
The Farther You Look, the Better the View
I came across a meme the other day that showed two people on either aisle of a bus headed up a steep mountain. The passenger on the left faced a dark gray slab of granite, grimacing with worry as the bus hugged a narrow and winding road. The passenger on the right side, conversely, smiled as he happily looked out over a beautiful mountain range, the sun shining on peaks and valleys, creating a picturesque scene. The dreary side of the bus was termed “day to day market moves”; the bright side was tagged “long term investing.” Two passengers, same bus, same road, very different viewpoints. The metaphor struck a chord.
I have found myself uncharacteristically optimistic during this tumultuous and difficult market year.While we regularly wish for that crystal ball that will tell us when things are turning around for good and square our shoulders against another rough week in the market, we simply cannot know the details of the market movement in advance. Still, there is a lot we do know to instill confidence that the turn will come. The best predictor of future behavior is past behavior. One only needs to look at historical facts and statistics to find some hope.
The economic cycle is just that – a dependable cycle. Like seasons, there is always unpredictability, like a 70 degree day in November in Maine, but we know winter is still coming. There is wide variation in each economic cycle, but history tells us a cycle lasts about five and a half years on average. The average bear market lasts twelve to eighteen months. The average bull market duration is just under four years. The longest bull market to date lasted from March of 2009 to March of 2020, when COVID brought the world to a standstill. But by the end of March 2020, the S&P was on the rise, seeing a 52% increase by August’s record highs.It’s a cycle, and we knew that winter would come, but not when it would arrive or how stormy a season it would be. And we know that spring will come after winter. The market will return.
Bear markets produce an average 36% loss. Stocks gain 112% on average during a bull market. We typically look at historical returns to project future returns. 2022 has been the worst start to a year for the S&P since 1974 and 2002. In 1974, the bear market bottomed out on October 3. In 2002, it bottomed out on October 9. Additionally, the fourth quarters of midterm election years tend to be very good. In 17 of 19 midterms since 1946, the market performed better in the six months following an election than in the six months leading up to it. September is typically a bad month for the stock market. December is typically a good month. In the last twenty times the S&P has hit a 52 week low (since 1950), one year later, the market is higher 90% of the time and on average, it is up 20%.
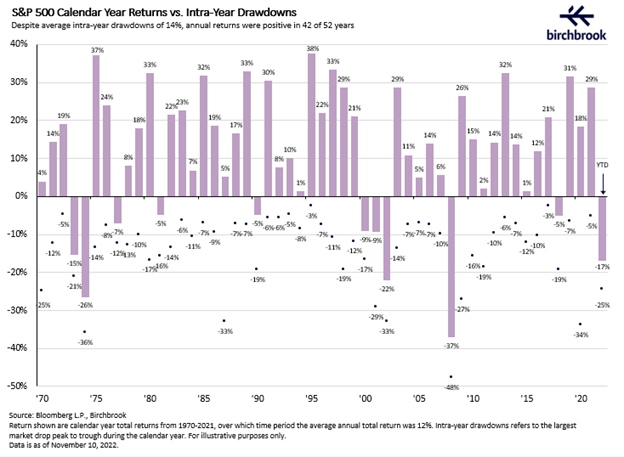
Watching the market daily is exhausting even in the best of times. Of the last 42 years, the intra-year decline has averaged 14%. Despite that volatility, the market has returned a positive annual return in 35 of the last 42 years (83% of the time!) and yielded a 12% average annual return. Daily fixation on the volatility of the market is like staring out the window at a granite wall. Looking at the long term, you realize a much rosier picture of growth over time, increasing elevation despite the peaks and valleys that we travel through to reach the top of the mountain.
Patience and endurance are key characteristics of long term investors. If you can remain focused and determined during the ups and downs of the journey, you can have the constitution to look for opportunities along the way, and weather the change in altitude as it comes and goes. Keep your eyes on the horizon, and let us manage the ups and downs of the path. Our goal is to help you enjoy the view.